Fleet Maintenance KPIs: 12 Metrics That Actually Matter

You can't improve what you don't measure. Yet many fleet managers rely on gut feeling rather than data when making maintenance decisions. They know some vehicles seem to break down more than others, but they can't quantify the impact or identify patterns.
Fleet maintenance KPIs change that. They transform vague impressions into actionable numbers - numbers that help you justify budgets, identify problem vehicles, and prove the value of your maintenance program.
This guide covers the metrics that matter most, how to calculate them, and what benchmarks to aim for.
Vehicle Availability Metrics
These KPIs measure how often your vehicles are available for use. High availability means you're getting maximum value from your fleet investment.
1. Fleet Availability Rate
The percentage of your fleet that's available for use at any given time. This is arguably the most important fleet metric because it directly impacts your ability to serve customers and generate revenue.
Formula: (Vehicles Available / Total Fleet Size) × 100
Benchmark: Well-managed fleets maintain 95%+ availability. Below 90% indicates serious maintenance issues.
How to improve: Track which vehicles are most often out of service and investigate root causes. Often a few problem vehicles drag down the entire fleet's numbers.
2. Vehicle Downtime
The total time vehicles spend out of service due to maintenance or repairs. Track this in hours or days per vehicle per period (month, quarter, year).
Formula: Total Hours Out of Service / Number of Vehicles
Key insight: Break this down by planned downtime (scheduled maintenance) vs. unplanned downtime (breakdowns). A high ratio of unplanned to planned downtime indicates your preventive maintenance program needs work.
3. Mean Time Between Failures (MTBF)
The average time a vehicle operates between breakdowns. Higher MTBF means more reliable vehicles and better preventive maintenance.
Formula: Total Operating Time / Number of Failures
How to use it: Compare MTBF across vehicle types, ages, and uses. If one vehicle model consistently underperforms, factor that into future purchasing decisions.
4. Mean Time to Repair (MTTR)
The average time it takes to complete a repair once a vehicle is out of service. This measures your maintenance team's efficiency and your parts availability.
Formula: Total Repair Time / Number of Repairs
How to improve: Long MTTR often indicates parts availability issues. Track which repairs take longest and ensure you the have common replacement parts in stock.
Cost Metrics
These KPIs help you understand and control maintenance spending. They're essential for budgeting and identifying cost-saving opportunities.
5. Maintenance Cost per Mile/Kilometer
The total maintenance spend divided by total distance traveled. This normalizes costs across vehicles with different usage patterns.
Formula: Total Maintenance Cost / Total Miles (or Kilometers)
Benchmark: Varies widely by vehicle type and usage. Your goal is to establish your baseline and track trends over time rather than comparing to external benchmarks.
6. Maintenance Cost per Vehicle
Total maintenance spending divided by fleet size. Useful for budgeting and comparing against industry averages.
Formula: Total Maintenance Cost / Number of Vehicles
Key insight: Track this per vehicle to identify outliers. A vehicle consistently costing 2-3x the fleet average may be a candidate for replacement.
7. Planned vs. Unplanned Maintenance Ratio
The percentage of maintenance work that was scheduled in advance versus emergency repairs. This is a key indicator of maintenance program maturity.
Formula: (Planned Maintenance Hours / Total Maintenance Hours) × 100
Benchmark: Best-in-class fleets achieve 80%+ planned maintenance. If more than half your maintenance is reactive, you have significant improvement opportunities.
8. Parts Cost as Percentage of Total Maintenance
How much of your maintenance budget goes to parts versus labor. Helps identify whether you're overpaying for parts or if labor efficiency needs attention.
Formula: (Parts Cost / Total Maintenance Cost) × 100
Typical range: Parts usually represent 40-60% of maintenance costs. Significantly higher may indicate parts pricing issues; significantly lower may indicate labor inefficiency.
 Maintenance Efficiency Metrics
These KPIs measure how effectively your maintenance team operates.
9. PM Compliance Rate
The percentage of scheduled preventive maintenance tasks completed on time. Low compliance undermines the entire purpose of having a PM program.
Formula: (PMs Completed On Time / Total PMs Scheduled) × 100
Benchmark: Aim for 90%+ compliance. Below 80% means your PM schedule is either unrealistic or not being prioritized.
10. Work Order Completion Rate
The percentage of work orders completed within their target timeframe. Tracks overall maintenance team productivity.
Formula: (Work Orders Completed On Time / Total Work Orders) × 100
11. Repeat Repair Rate
The percentage of repairs that need to be redone within a short period (typically 30-90 days). High repeat repairs indicate quality issues in your maintenance work.
Formula: (Repeat Repairs / Total Repairs) × 100
Benchmark: Should be under 5%. Higher rates suggest training issues, parts quality problems, or incomplete initial diagnosis.
12. Roadside Breakdown Rate
The number of breakdowns that occur while vehicles are in service, expressed per 1,000 miles or per vehicle per year. This is the ultimate test of your preventive maintenance program.
Formula: (Roadside Breakdowns / Total Miles) × 1,000
Why it matters: Roadside breakdowns are expensive - towing costs, emergency repairs at premium rates, missed deliveries, and driver idle time. Every breakdown you prevent through good PM saves significant money.
How to Track Fleet Maintenance KPIs
You can't calculate these metrics without good data. Here's what you need to capture:
Essential Data Points
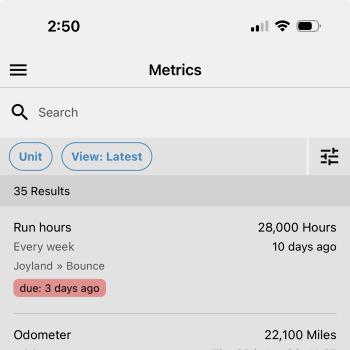
Odometer readings - at every service event and regularly in between
Service dates and times - when work started and completed
Work order types - planned PM vs. unplanned repair
Labor hours - time spent on each job
Parts used and costs - what was installed and what it cost
Failure codes - what component failed and why
Use a CMMS
Spreadsheets can work for very small fleets, but they quickly become unmanageable. A CMMS (Computerized Maintenance Management System) captures this data automatically as work is performed and calculates KPIs for you.
Look for software that:
Lets technicians log work from mobile devices
Tracks odometer readings at each service
Differentiates between planned and unplanned maintenance
Generates reports on key metrics
Alerts you when KPIs fall outside acceptable ranges
Setting KPI Targets
Industry benchmarks are useful starting points, but your targets should be based on your own baseline performance. Here's a practical approach:
Establish your baseline - Track metrics for 3-6 months before setting targets
Set realistic improvement goals - 5-10% improvement per year is achievable for most metrics
Focus on 3-5 metrics at a time - Trying to improve everything at once usually means improving nothing
Review and adjust quarterly - Celebrate wins, investigate misses, adjust targets as needed
Common KPI Mistakes to Avoid
Tracking Too Many Metrics
If you're drowning in data, you won't act on any of it. Pick the 3-5 KPIs most relevant to your current goals and focus there.
Ignoring Context
A delivery van making 50 stops per day will have different maintenance needs than a long-haul truck. Compare vehicles with similar usage patterns, not just raw numbers.
Optimizing the Wrong Thing
Cutting maintenance costs looks great on a spreadsheet, until vehicle availability tanks and you're spending more on emergency repairs and roadside assistance. Always consider KPIs together, not in isolation.
Not Acting on the Data
KPIs are only useful if they drive decisions. If a vehicle has twice the maintenance cost of similar vehicles, investigate why. If PM compliance is low, find out what's blocking completion.
Start Measuring Today
You don't need perfect data to start improving. Begin with the metrics you can measure now, and build from there.
If you're not tracking anything today, start with these three:
Fleet availability rate - How many vehicles are on the road vs. in the shop?
Maintenance cost per vehicle - What are you spending, and which vehicles cost most?
PM compliance rate - Are scheduled services actually getting done?
Once you have visibility into these basics, you can expand to more sophisticated metrics as your maintenance program matures.
Fleet maintenance software like Maintainly makes it easy to capture the data you need and generate reports on these KPIs automatically. When your technicians log work orders from their phones, the metrics calculate themselves, giving you the insights you need to reduce costs and improve uptime.
Further Reading

How can preventive maintenance software help large vehicle fleets?
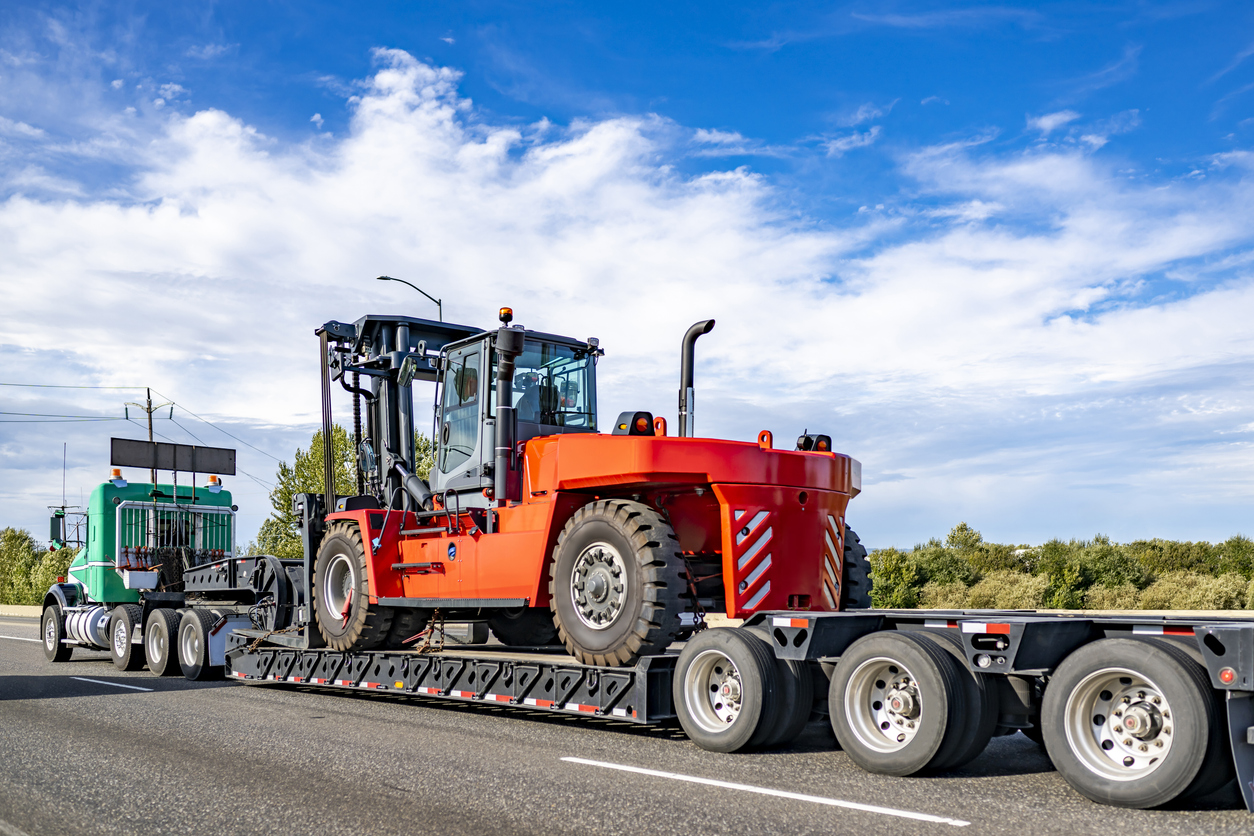
The modern economy consists of millions of companies of all sizes. For many of these firms, operating a large vehicle fleet is a key part of how they get day-to-day tasks done. This often requires fleets of cars, vans, trucks, service equipment and heavy machinery.
Read more →
Preventive vs Reactive Maintenance: Why CMMS is the Game-Changer
The choice between preventive and reactive maintenance can make or break the efficiency and longevity of your assets. As an expert blogger in the field, I'm here to shed light on the crucial role that Computerized Maintenance Management Systems (CMMS) play in this decision-making process.
Read more →
Maintenance Management Software for SMB's - Five Key Considerations
When considering a maintenance management system for smaller businesses, there are several important aspects to look for. We explore five important things for SMB's to look for when assessing maintenance management software.
Read more →