Thermal Imaging for Preventive Maintenance: How to Capture Reliable Inspection Data
 By Gui
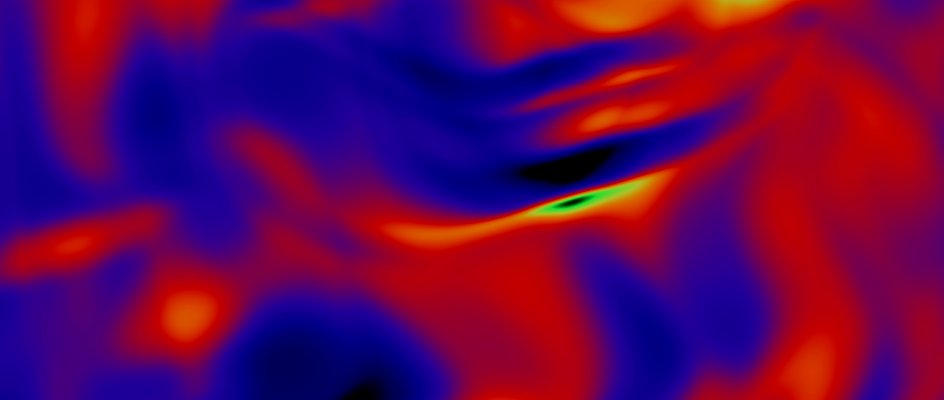
Most equipment failures announce themselves in heat long before they announce themselves in downtime. Thermal imaging is what turns that early warning into something a technician can actually see. This article explains how to gather reliable inspection data for preventive maintenance, from defining what you are inspecting, through consistent field capture, to turning findings into action.
Why Thermal Imaging Supports Preventive Maintenance
Before getting into technique, it helps to be clear on why heat is such a valuable signal, and why a heat map alone is not yet a diagnosis.
Finding Abnormal Heat Patterns Before Failure Occurs
Heat is often the earliest and most reliable indicator of mechanical or electrical distress. An IR camera can pick up thermal anomalies 60 to 90 days before a catastrophic failure. For example, a motor bearing running above its baseline or a loose electrical connection warming under load.
The risks are real. Many unexpected shutdowns start with electrical faults that slowly overheat for weeks before failing. Infrared thermography helps spot that heat early, turning a future breakdown into a repair you can schedule now.
Understanding Why Thermal Images Need Context Before Action
A thermal image is a map of apparent temperatures, and apparent temperatures mislead without context. A component reading a given temperature may be perfectly healthy under full load yet dangerously hot if the system is barely running. The number on the screen means nothing until it is placed against the equipment’s design specifications, its current load, and the ambient conditions around it.
This is why interpretation, not capture, is where thermography succeeds or fails. The goal is to distinguish a genuine red flag from a routine reading, and that judgment depends entirely on the context recorded alongside the image.
Define the Inspection Objective and Conditions
Reliable data starts before the camera is switched on. Knowing what you are inspecting, under what conditions, and to what end keeps a thermal inspection purposeful. So how do you set that objective before you start shooting?
Identifying the Asset, Component, or System Being Inspected
Effective programs prioritize assets by criticality and failure history rather than scanning everything equally. Typical targets fall into a few families:
electrical systems such as switchgear, motor control centers, and distribution panels;
mechanical equipment such as bearings, gearboxes, and belt drives;
process systems such as steam traps, piping, and heat exchangers;
building envelopes such as roofs, walls, and HVAC ducting.
Naming the specific component up front matters because each family carries its own baseline, its own acceptable temperature spread, and its own follow-up path when something looks wrong.
 Confirming Operating Load, Environmental Conditions, and Inspection Timing
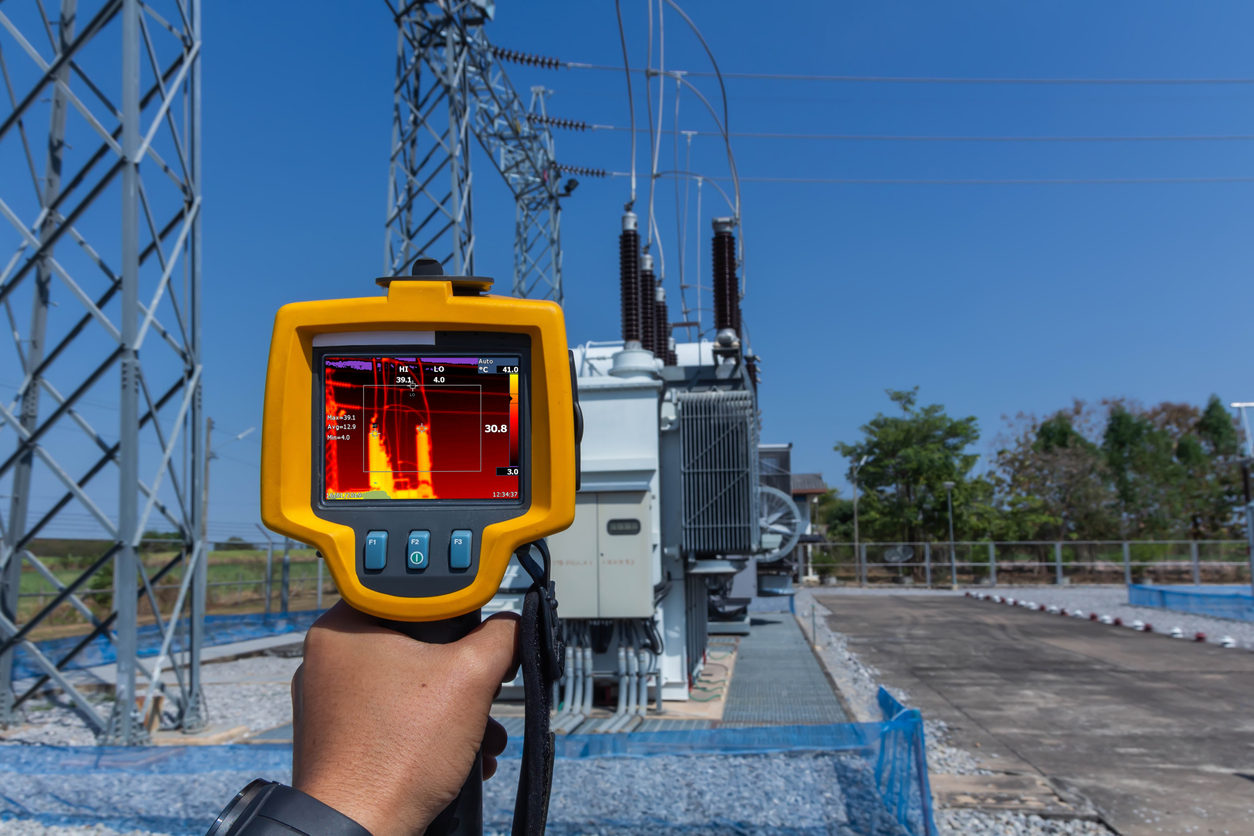
First, remember that faults reveal themselves under load. Inspections should be run while equipment is working at meaningful capacity, ideally 80% or higher, because a lightly loaded circuit or bearing may not generate a detectable heat signature. A clean image of an idling asset can hide the very defect you are looking for.
Environment matters just as much. Outdoor work should avoid direct sunlight, high wind, and rain, all of which distort surface temperatures. Meanwhile, early morning or evening reduces solar loading. Indoor building surveys benefit from a stable temperature differential, often at least 10 °C between inside and outside held for around 24 hours, so that the contrast you are measuring is real and not weather noise.
Deciding Whether the Goal Is Screening, Trending, or Follow-Up Investigation
Each inspection should have one of three clear intents:
Screening: periodic scans across a large group of assets to surface new anomalies.
Trending: tracking how a component’s temperature shifts over successive cycles to gauge its rate of degradation.
Follow-up: confirming that a repair has returned a part to its known-good baseline.
Deciding which of these you are doing shapes everything downstream: how many points you capture, how tightly you control conditions, and how you compare the result later.
Capture Thermal Images Consistently in the Field
Consistency is what separates data you can trend from images you can only glance at. The field routine should be repeatable enough that two inspections months apart are genuinely comparable.
Following Site Safety Procedures Around Energized or Moving Equipment
The non-contact nature of thermography is itself a safety benefit, as it lets you inspect live, energized systems from a distance rather than opening them up. That advantage does not remove the hazard, though. Technicians still need:
appropriate PPE;
safe approach distances around high-voltage infrastructure;
adherence to site lockout and arc-flash procedures.
Setting the Camera Focus, Distance, Angle, and Field of View
Accuracy depends heavily on operating the instrument correctly. Focus is not cosmetic; an out-of-focus image produces incorrect temperature measurements. Thus, capture from angles and distances that give full coverage of the target. And when inspecting reflective surfaces like bare metal or glass, tilt the lens slightly to avoid mirroring, where the camera reads its own reflection instead of the component's real temperature.
Capturing Thermal and Visual Context from Repeatable Locations
Trending only works if every image is taken from the same place, angle, and distance across inspections. Many programs mark assets with QR codes so technicians shoot from a fixed position and link the data straight to the correct equipment record. Also, pairing each thermal frame with a matching visual photo, and taking multi-directional shots where obstructions or reflections are a risk, gives the interpreter the context they need to trust the reading.
Control the Main Factors That Affect Thermal Readings
A camera reports what physics hands it, and several factors sit between the true surface temperature and the number on the display. Controlling them is what makes a reading defensible.
Setting Emissivity and Accounting for Reflected Apparent Temperature
Emissivity, a material’s ability to emit infrared energy, varies enormously, and getting it wrong skews everything. Bare aluminum sits near 0.05 while painted steel sits near 0.95, so a camera left on the wrong setting can badly underreport a shiny component’s actual temperature. Set emissivity for the specific surface, or measure it, rather than trusting a default.
You also have to account for reflected temperature. Energy from nearby hot objects can bounce off the target and reach the lens, inflating the reading. On busy equipment surrounded by motors, lighting, or sun-warmed surfaces, correcting for that reflected apparent temperature is often the difference between a false alarm and an accurate figure.
Considering Distance, Atmosphere, Humidity, IR Windows, or External Optics
The path between camera and target also shapes the result. Distance, wind, humidity, and atmospheric transmittance all attenuate the signal to some degree. When scanning panels through IR windows, set the camera to match the window’s properties, since it only lets some infrared energy through.
Checking Resolution, Thermal Sensitivity, Temperature Range, and Calibration for Reliable Readings
The instrument itself has to be capable of the job. It needs enough spatial resolution and thermal sensitivity (NETD) to resolve a small anomaly at the working distance, and a temperature range that covers what the asset can reach. Regular calibration against a blackbody source keeps those measurements consistent over time. Because those specifications vary widely across models, selecting the right thermal imaging camera for the distances and detail determines whether marginal faults are ever seen at all.
Interpret Findings and Plan Follow-Up Actions
Capturing a good image is half the work; the other half is knowing what it means and what to do next. Interpretation is where discipline pays off.
Comparing Similar Components Under Similar Operating Conditions
Comparative analysis is one of the most dependable diagnostic moves. In a three-phase electrical system, all phases carrying similar load should read similar temperatures, so a single hot outlier points clearly toward a loose connection, an imbalance, or a developing fault. Comparing like against like under matched conditions removes much of the ambiguity that a single absolute number carries.
Distinguishing Temperature Difference from Confirmed Fault Diagnosis
Severity is usually judged by the temperature delta (ΔT) between the anomaly and its baseline or a matched component, not by the raw temperature alone. Many programs treat a differential of roughly 15 °C or more as critical and warranting immediate intervention, while smaller deltas may only justify monitoring or scheduled maintenance.
Knowing When Electrical, Mechanical, or Process Testing Is Needed Next
Thermography is a surface-only technology that cannot see through solid enclosures or inside a cable. A confirmed anomaly should therefore be cross-referenced with the right follow-up. Electrical thermography findings on a warm cable may lead to insulation resistance testing to confirm integrity. Meanwhile, a hot bearing found during mechanical inspection points toward vibration analysis to pin down the root cause. The thermal image says where to look; another test often says why.
Creating Reports and Baselines for Future Preventive Maintenance Inspections
Every program should build a baseline library of thermal profiles captured under normal, known-good conditions, so future scans have something honest to be measured against. Finally, disciplined thermal image reporting builds a permanent asset history by documenting:
equipment IDs;
measured values;
ambient conditions;
emissivity settings;
severity ratings.
Over time, that record turns isolated inspections into genuine condition monitoring.
Why Disciplined Thermography Pays Off
Thermal imaging proves its value by spotting problems early. That early warning often pays off, with returns of around 8–10× the cost once you factor in avoided emergency repairs and downtime. But that payoff is not automatic; it belongs to programs that treat capture and interpretation as a discipline.
A useful inspection comes down to a few basics: check under real load, capture images from consistent positions, and set emissivity and reflected temperature correctly. Then compare temperature differences against a clear baseline before acting. Done consistently, infrared thermography becomes a reliable early-warning system that keeps facilities safe and running smoothly.
Further Reading

Preventive vs Reactive Maintenance: A Complete Guide
Preventive, corrective, reactive, condition-based and predictive maintenance explained, which assets deserve a schedule, and how a CMMS makes the shift from firefighting to planned work.
Read more →
What Does CMMS Stand For? Acronym and Meaning
What the CMMS acronym stands for, what the software records once a team has one, and where the category stops.
Read more →
Embracing Modernity: The Advantages of Web-Based Maintenance Management Software over Legacy Options
While older legacy maintenance management systems served their purpose in the past, the rise of modern web-based software has revolutionised the way companies approach maintenance. Modern web-based maintenance management software surpasses its legacy counterparts in terms of functionality, total cost of ownership, scalability, and cost-effectiveness, without the hangups.
Read more →